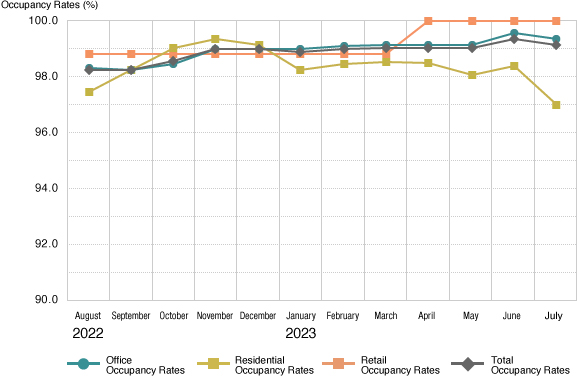
Trend in Occupancy Rates
Trend in Occupancy Rates
33rd fiscal period (January 2023) ・34th fiscal period (July 2023)
Detail of Occupancy Rates
33rd fiscal period
(January 2023) |
August
2022
|
September |
October |
November |
December |
January
2023
|
Occupancy
rates
(%) |
Office |
98.3 |
98.2 |
98.4 |
99.0 |
99.0 |
99.0 |
| Residential |
97.4 |
98.2 |
99.0 |
99.3 |
99.1 |
98.2 |
| Retail |
98.8 |
98.8 |
98.8 |
98.8 |
98.8 |
98.8 |
| Total |
98.2 |
98.2 |
98.5 |
99.0 |
99.0 |
98.9 |
Total
leasable
floor
area
(㎡) |
Office |
144,410.32 |
144,410.32 |
144,410.32 |
144,410.32 |
144,410.32 |
144,407.75 |
| Residential |
28,544.02 |
28,544.02 |
28,544.02 |
28,544.02 |
28,544.02 |
28,544.02 |
| Retail |
8,382.44 |
8,382.44 |
8,382.44 |
8,382.44 |
8,202.88 |
8,202.88 |
| Total |
181,336.78 |
181,336.78 |
181,336.78 |
181,336.78 |
181,157.22
|
181,154.65 |
34th fiscal period
(July 2023) |
February
2023
|
March |
April |
May |
June |
July
|
Occupancy
rates
(%) |
Office |
99.1 |
99.2 |
99.2 |
99.2 |
99.6 |
99.4 |
| Residential |
98.4 |
98.6 |
98.5 |
98.1 |
98.4 |
97.0 |
| Retail |
98.8 |
98.8 |
100.0 |
100.0 |
100.0 |
100.0 |
| Total |
99.0 |
99.1 |
99.1 |
99.1 |
99.4 |
99.1 |
Total
leasable
floor
area
(㎡) |
Office |
144,407.75 |
144,407.75 |
144,507.75 |
144,507.75 |
144,507.74 |
144,507.74 |
| Residential |
28,544.02 |
28,544.02 |
28,544.02 |
28,544.02 |
28,544.02 |
28,544.02 |
| Retail |
8,202.88 |
8,202.88 |
8,104.90 |
8,104.90 |
8,104.90 |
7,925.35 |
| Total |
181,154.65 |
181,154.65 |
181,156.67 |
181,156.67 |
181,156.66 |
180,977.11 |
- (Note 1)
- Rentable floor space is rounded to the one-hundredth decimal point. For real estate or property, rentable floor space is calculated by multiplying MHR's ownership by the entire building's rentable floor area. The occupancy rates are rounded to the one-tenth decimal point.
- (Note 2)
- The method for calculating occupancy rates has been changed from the 11th period as follows:
[With respect to complex, mixed use properties with both office and residential components]
Office Component → Square meters used as office are categorized as “Office”
Residential Components → Square meters used as residential are categorized as “Residential”